Every ransomware incident is a liquidity stress test in disguise. Systems freeze, receivables stall, and the cost of downtime compounds by the hour.
Here are six key performance indicators you can use to quantify resilience and tie it to business performance.
“When ransomware metrics sit beside liquidity and compliance KPIs, they stop feeling abstract.”
– Greg Guelcher, CFO, Coretelligent
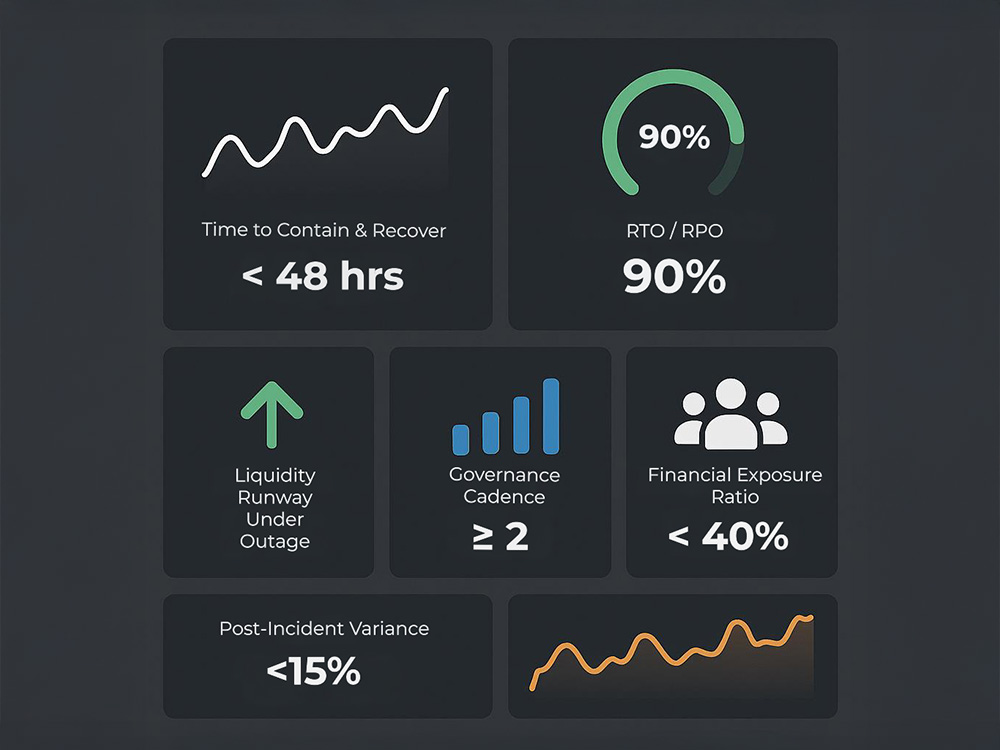
KPI 1 | Time to Contain & Recover
Median hours from detection to full restoration across critical systems – the clearest indicator of disruption cost.
| Formula | MTTD (mean time to detect) + MTTR (mean time to restore) |
| Healthy range | < 48 hrs (core apps); < 72 hrs enterprise-wide |
| CFO Insight | Every hour saved protects real working capital and customer confidence. |
KPI 2 | Recovery-to-Target Alignment (RTO / RPO)
The percentage of business-critical systems that meet objectives for recovery time (RTO) and recovery point (RPO).
| Formula | Systems meeting targets ÷ total critical systems |
| Healthy range | ≥ 90 % alignment |
| CFO Insight | Missed targets mean missed revenue. Review quarterly and treat gaps as unfunded downtime risk. |
KPI 3 | Liquidity Runway Under Outage
Days the organization can operate without new revenue during a disruption.
| Formula | (Unrestricted cash + committed credit lines) ÷ average daily operating cost |
| Healthy range | 7–10 days coverage (minimum); higher for slow-receivables industries |
| CFO Insight | Liquidity is the ultimate recovery metric – because you can’t patch payroll. |
KPI 4 | Financial Exposure Ratio
The balance of insured, self-insured, and uninsured ransomware losses.
| Formula | (Uninsured loss ÷ total potential loss) × 100 |
| Healthy range | < 40% uninsured exposure |
| CFO Insight | Insurance can only take you so far; real resilience comes from preparation. |
KPI 5 | Governance Cadence
Frequency of enterprise-wide resilience simulations that include Finance and Operations.
| Formula | Number of full-scope exercises per year × Finance participation rate |
| Healthy range | ≥ 2 cross-functional simulations annually |
| CFO Insight | Recovery speed depends on rehearsal and readiness. |
KPI 6 | Post-Incident Variance
Gap between projected and actual downtime or spending after an incident.
| Formula | | Actual − Estimated | ÷ Estimated × 100 |
| Healthy range | < 15 % variance |
| CFO Insight | Treat every incident as a financial audit of your assumptions. |
How to Use This Dashboard
- Report these metrics alongside liquidity, compliance, and reserve KPIs.
- Track progress to show improvement and use data to guide governance investments.
- Integrate results into Audit, Risk, and Finance reviews so boards see resilience as a measurable business outcome.
Download the CFO’s Ransomware Resilience Framework for a seven-move framework that links governance, insurance, and recovery planning to financial performance.